The following Excel file download is a fully practical sample Horizon Planning Spreadsheet that is typical of the ones I have used many times to manage software products.
And the following is a pdf of this page you are reading now.
Please feel free to download it and adapt it for your software projects.
For a short intro to method and the benefits of Horizon Planning see Horizon Planning Intro. For a more complete exposition of the method, my textbook is also available at Horizon Planning Textbook.
And here is a video explaining the details of the sample Horizon Plan:
I will now go through the spreadsheet in detail and explain how it’s put together and used.
There are three tabs on the spreadsheet.

- Globals
Contains reference constants – the holiday schedule. - Graph Data
Contains historical data used to plot the graphs. - Horizon Plan
Where all the action is.
We’ll come back to Graph Data and Globals. For now, let’s focus on the Horizon Plan tab.
Horizon Plan Tab
It’s major sections are as follows.
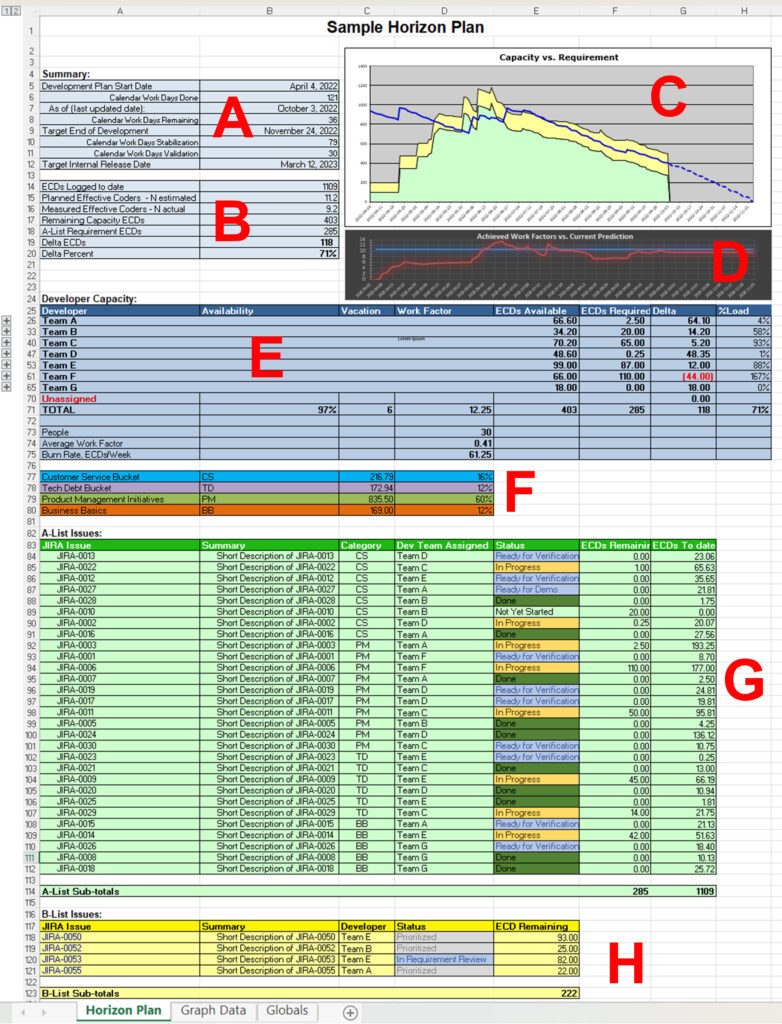
B. This is the Summary section that indicates if our plan is on track or not.
C. This is a burndown of the remaining capacity and remaining requirement.
D. This is a comparison of historically measured capacity to currently predicted capacity.
F. This is a summary of the major areas the effort has gone to / is going to.
A – Dates

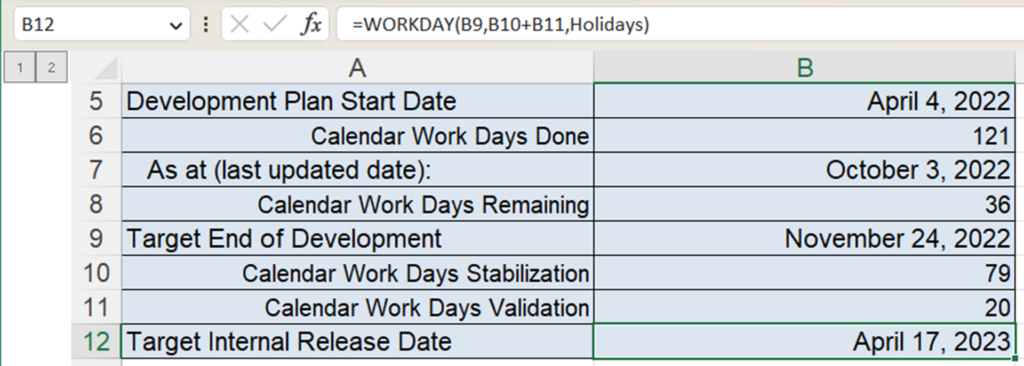
Development Plan Start Date, also known as fork, is the date on which the planning horizon starts.
As at is the date the plan was last updated.
Calendar Work Days Done are the number of working days from fork to as-at (excludes weekends, statutory holidays, and any days where it is known in advance no coding work on the features is expected to be done, e.g., a big company offsite).
Target End of Development, also known as dcut, is the date we are aiming to be done the major coding. All the devs working on all the A-List Features need to be able to say they are not aware of any more code that needs to be merged in (including essential test code) for the feature development to be complete (more tests may be added later).
Calendar Work Days Remaining are the number of working days remaining between as-at and dcut.
Target Internal Release Date is the date that the dev team plans to declare they are fully done developing and testing the software. This date is computed based on the three fields above it.
Calendar Work Days Stabilization is the number of workdays estimated to stabilize the software after dcut. In this sample plan it is computed as 50% of the workdays between fork and dcut. During this time, the devs are all expected to be available to fix any issues discovered as a first priority. With any spare time, they can do further test development or get a jump on the next horizon.
Calendar Work Days Validation is a constant number of workdays tacked onto the end of stabilization for a final QA run-through.
Note that this particular incarnation of the Horizon Plan (HP) is designed for mission-critical enterprise on-premises software installed into diverse customer environments and upgraded in diverse ways by the customer, hence the lengthy stabilization and validation phases towards the end.
For cloud-based software with more continuous delivery-to-production over the horizon, these phases are eliminated. In part they are not needed as there is only one self-hosted operating environment for the software, and in part these dev teams will typically spend much more in the Dev phase on infrastructure-as-code, various types of automated testing, automated deployment code, and production monitoring code. In this case, the Horizon does not represent a “Release” of the software, but rather a business-convenient planning horizon (e.g., 6 months).
B – Summary

ECDs Logged To Date is the number of “Effective Coder Days” (logged ideal hours spent coding divided by 8) across the entire team from fork to as-at.
Planned Effective Coders – N estimated is a forward-looking estimate of the average number of ECDs the team will put in per workday from as-at to dcut. It is computed by dividing the estimated remaining capacity ECDs (365 – computed in section E and brought up here) by the remaining workdays (36 – computed in section A).
Measured Effective Coders – N actual is an average of the number of ECDs the Devs have been putting in per recent workdays (it is an exponentially decaying average computed on the Graph Data tab).
Remaining Capacity ECDs is the total estimated remaining capacity of the team from as-at to dcut. This takes into account the remaining workdays, any holidays, any estimated vacation during that period, any partial allocations of time to other pursuits, and the Dev work factors (how many ECDs per workday they estimate they can get done averaged over the remaining workdays). It is computed in section E and brought up here.
A-List Requirement ECDs is the total estimated remaining requirement for ECDs to complete all the “A-List” features. It is computed in section G and brought up here.
Delta ECDs is the difference between the above two. A negative value is bad.
Delta Percent is the ratio between estimated remaining requirement and capacity. We generally want to keep this around 70% to provide a safety buffer for the A-List and allow time for some B-list items to make it.
C – Capacity/Requirement Burndown Chart
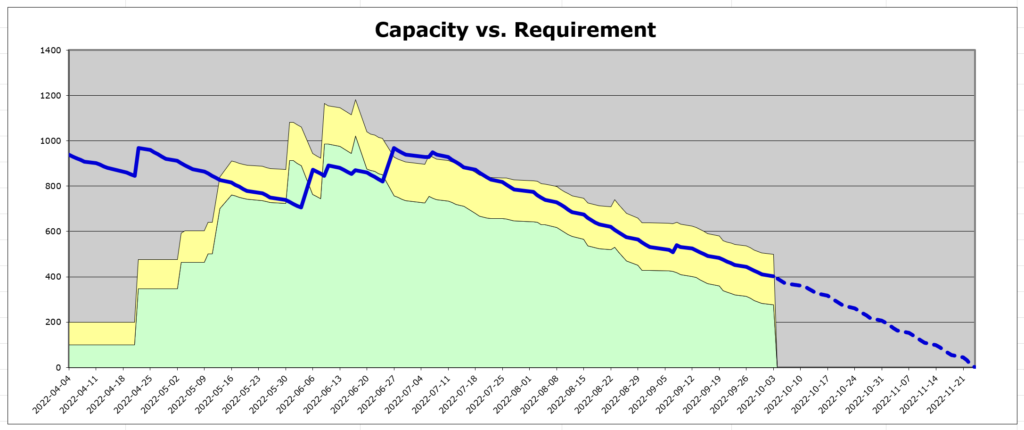
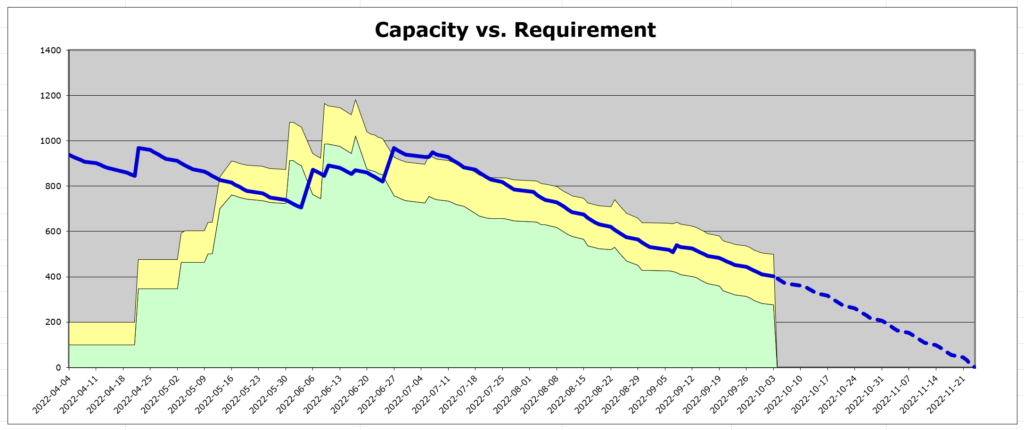
This chart records historical values of estimated capacity (solid blue line) and estimated remaining requirement for the A-List features (green) and B-list features (yellow). Dotted blue is the projected capacity decrease as we reach dcut. This chart can be used to get a quick visual indication if the plan seems to be on-track (the blue and green decreasing at approximately the same rate).
In this sample plan, looking at the green, work started at 04-14 but the plan was not yet full and requirements kept coming in until around 06-20. Meanwhile, looking at the blue, there appears to have been some adjustments of the end date and some re-estimation up of work factors. By 07-11 the estimates seem to be better dialed in and estimated remaining capacity and requirements burn-down in tandem.
The data for this chart is sourced from the Graph Data tab which has a time series that is added onto on each plan update.
[Special thanks to my friend and colleague Matt Medland for adding this concept]
D – Measured versus Predicted Capacity

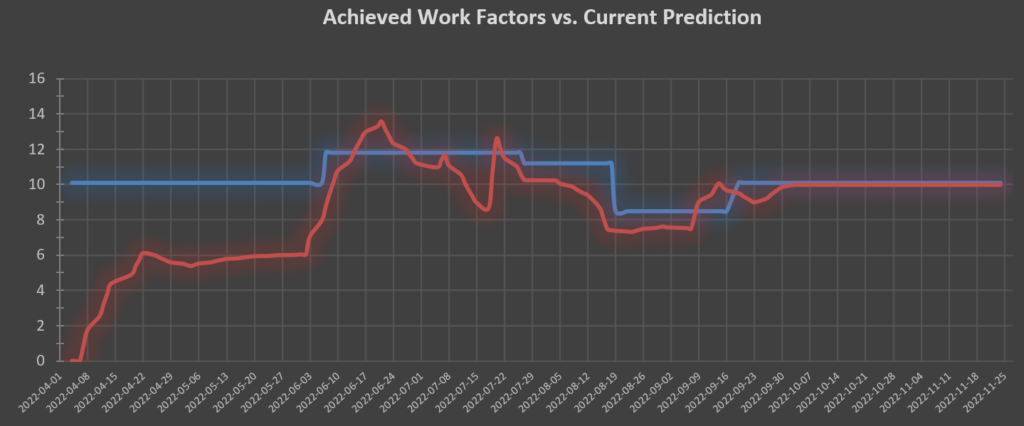
This chart plots the historical go-forward estimate of average daily capacity (blue) and the recent measured average daily capacity as of that date. It can be used to determine at a glance if our current estimates of daily capacity seem to be in accordance with our recent actual daily capacity. Our minds average out the blips.
The data for this chart is sourced from the Graph Data tab which has a time series that is added to on each plan update. The red line is a smoothed exponential decaying average of instantaneous daily measured capacity (λ = 0.1).
E – Dev Capacity
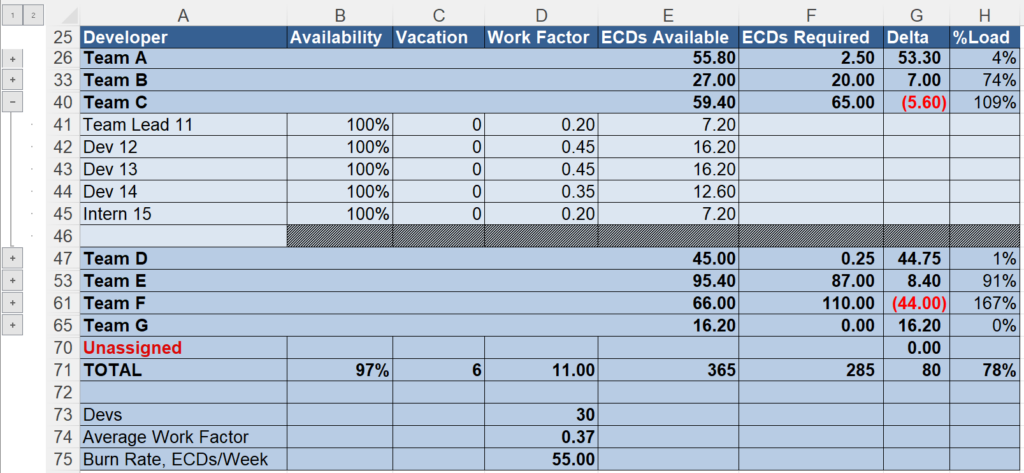
Developer lists all the individuals who are expected to contribute coding work to the effort, grouped into teams (Team C is expanded). In an actual plan, these would be real names.
Availability is the fraction of the dev’s work time expected to be devoted to this effort. For example, if a dev is split evenly across two initiatives it would go in as 50%.
Vacation is an estimate of the remaining vacation days to be taken by the dev from as-at to dcut.
Work Factor (w) is an estimate of the average number of ideal hours (8*w) per workday each dev expects to spend on individual contributor “coding work” on items in the plan from as-at to dcut. “Coding work” can be defined in various ways but will typically include writing code, tests, and docs, and excludes any meeting time or time spent conceiving of and/or writing specs and designs. Whatever the precise definition is, it must match the definition used when estimating feature effort.
Note that work factors are typically lower for team leads, and will also be lower for architects or devs who do a disproportionate of other types of work (e.g., triaging and fixing defects found in the field, pipeline maintenance, production operations, and so on). A low work factor may also be coupled to a particularly productive dev who accomplishes a great deal in a short time. It is not a “value judgment”, it is a quantity defined and measured via granular time tracking.
ECDs Available is computed by (remaining workdays – vacation) * w * availability.
ECDs Required is computed at the team level only and is derived by summing the remaining estimates for all A-list features assigned to that team in section G.
Delta is the team-level difference between the ECDs Available and ECDs Required. Negative values indicates the team is currently overcommitted.
%Load is the ratio of ECDs Available to ECDs Required. Values greater that 100% indicates that the team is currently overcommitted.
The Unassigned row lists the sum of the estimates for any features not assigned to any team.
The TOTAL row is either an average or a sum depending on context.
Devs is a count of the number of individuals listed in the plan.
Average Work Factor is the average work factor across all the devs.
Burn Rate is the expected number of ECDs that can be accomplished by the entire team during a typical 5-day work week.
F – Feature Effort Summary

Gives the ECDs to-date plus estimated remaining (from section G) across broad categories in the A-list, expressing it both as absolute ECDs and the ECDs as a percentage of the total.
The categories should be setup depending on what has the most value. For this example, these categories are defined as follows.
- Product Management Initiatives
New features coming from product management designed to increase the marketability of the software. - Customer Service Bucket
New features championed by the customer service team to make life easier for themselves or for specific customers, but may not have broad marketability benefits. - Business Basics
Things that need to be done to the software to keep it current (e.g., upgrade the operating system or libraries to their latest stable releases, or keeping up with a partner’s latest releases of their software). - Tech Debt Bucket
Initiatives championed by the dev team to improve the architecture and performance of the software and clean up bad code or dead code.
Note that there is no category for “Defect Fixing”. In the exceptional case that a defect requires a high-effort fix, it will be treated like a feature. If a defect is found that is associated with a new in-plan feature, it is included as part of the development of that feature. Any effort spent on other defects is considered part of the “background noise” and is estimated by reducing the work factors accordingly.
G – A-List Feature Requirement
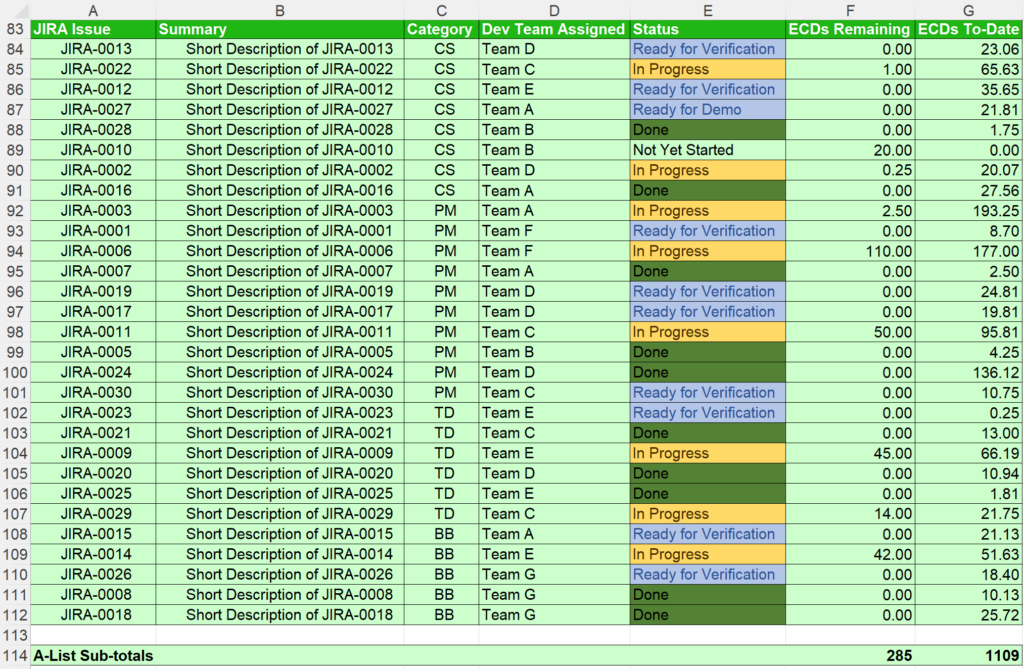
A table of all the A-List “Features” completed, in progress, or currently in-plan but not yet started.
A “Feature” is a cohesive unit of business value. It is typically at the top of a hierarchy of Jira issues, such as the following.
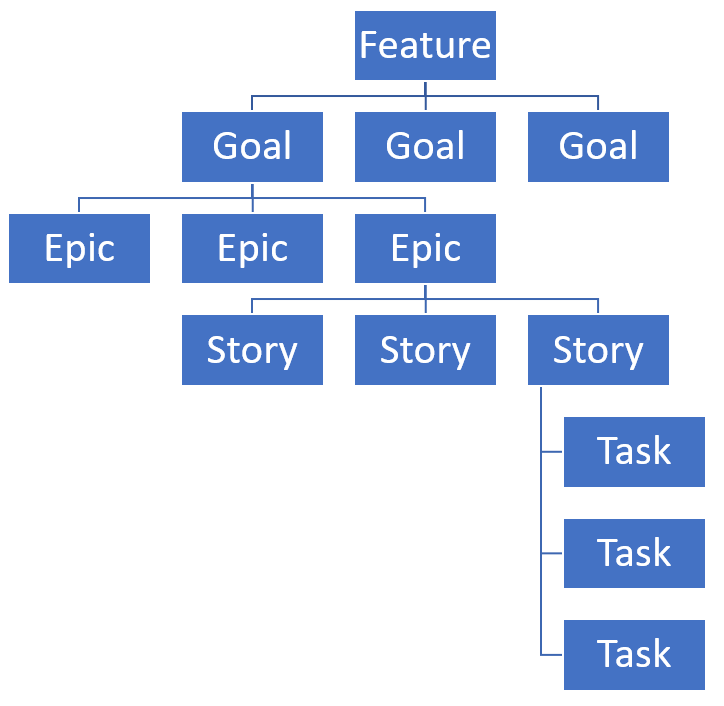
(with Goals and Epics as optional, and some teams preferring not to use Tasks).
Only the Feature level is exposed in the horizon plan. One can use a Jira plugin such as the Hierarchy Plugin to aggregate estimates and actual time up the hierarchy and pull a report that can be imported into the HP Spreadsheet on plan updates.
[one day somebody should write a Jira plugin for HP or an external SaaS system that integrates with Jira and do away with Excel. Now that I’m retired I’ll write something myself at some point, but partners are welcome!]
Jira Issue is a link back to the Feature-level Issue in Jira.
Summary is the short description of the Feature pulled from Jira.
Category is added in the release plan (or imported from a custom Jira field) and refers to the categories summarized in section F.
Dev Team Assigned is the dev team that is currently assigned to do the work. Often certain teams have expertise in certain areas, and an overcommitment on a certain team may indicate that people need to be moved and re-trained (or those types of features decreased).
Status is the current status of the Feature pulled from Jira and will differ based on local dev practices.
ECDs Remaining is the current estimate of the amount of effort required to complete the feature to dcut. The effort that is estimated should be compatible with how the Work Factor (w) is measured. Note that any ideal time estimate blends together the following three (inseparable) concepts:
- An estimate of the inherent size of the feature.
- An estimate of who will work on the feature.
- An estimate of how productive that person will be working on that feature.
- (how productive they will be with each ideal hour they can devote to it, NOT how many ideal hours they can devote to it over time – that is estimated in the work factor).
ECDs To-Date is the aggregate of all the ideal time spent to-date on each feature. I advocate that devs do fine-grained time-tracking of this one thing. Jira provides a “worklog” feature to enable this along with re-estimates of effort remaining. Tracking this closes the loop on feature and work factor estimates and allows for incremental improvement.
A-List Sub-Totals are the sub-total of effort spent and effort remaining on the A-List features.
H – B-List Feature Requirement

The B-List are additional features that a dev may work on once they have no work remaining on any A-List feature. Rather than simply “padding” the plan we strive to 100% fill the plan with A+B Features, however it is understood that the B-List Features are a stretch goal.
Graph Data Tab
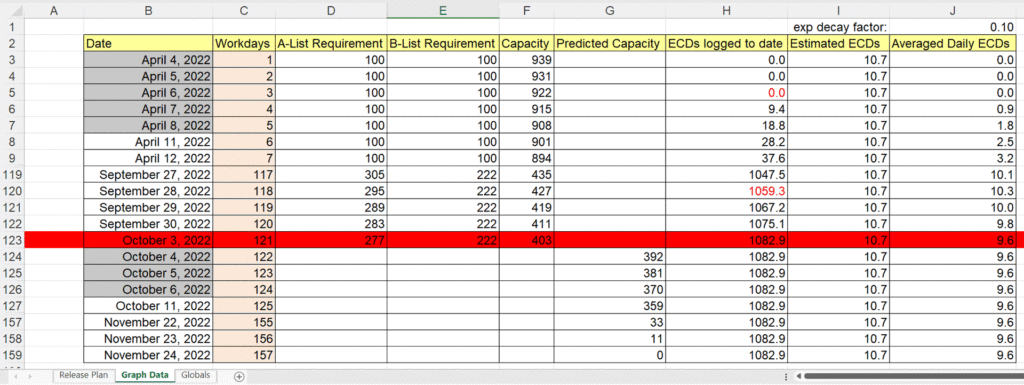
[Note the view above has certain rows hidden to enable it to fit on a screenshot]
The Horizon Plan (HP) should be updated on as regular a basis as possible (some managers do it daily, but weekly at a minimum). The update should be saved in a common directory under a new name that incorporates the as-at date in a sortable yyyy-mm-dd format. This way, historical HPs can be compared to recent HPs to understand what caused the plan to to get to where it is (e.g., compare the original estimates to the evolving estimates).
In addition to this, each plan update extends the history of key values in order to provide the historical graphs in sections C and D.
Initially, this tab is setup to include every workday (and only workdays) from fork to dcut. Once a plan update is made (such as the red row above), certain key values from the current plan are copied into this row. This will typically leave a number of blank entries between the previous update and the current one (e.g., cells D118:F122 in the below). These can be filled in using a Fill Series. Select the larger area contain the start cells and the end cells (D117:F123) and then Fill -> Series… from the Home ribbon.
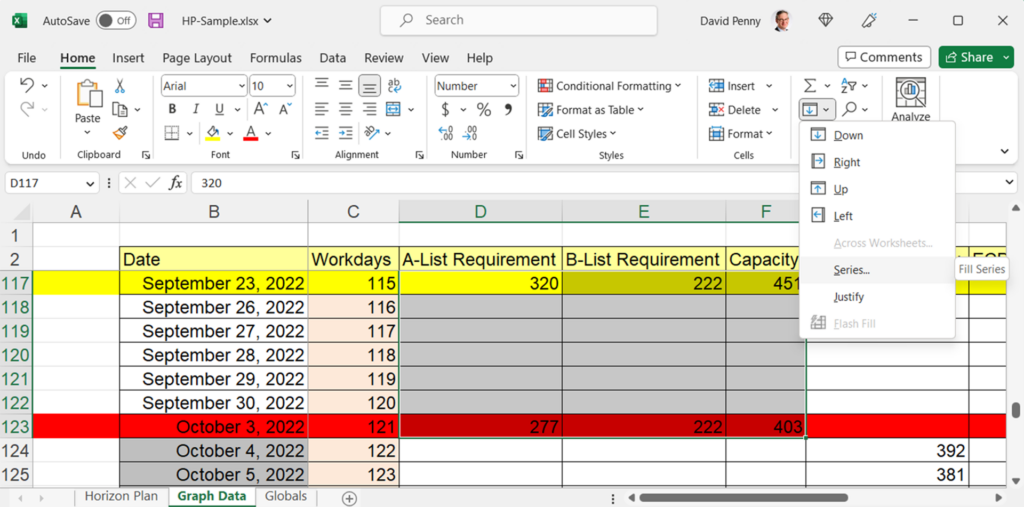
This brings up the Fill Series dialog box.
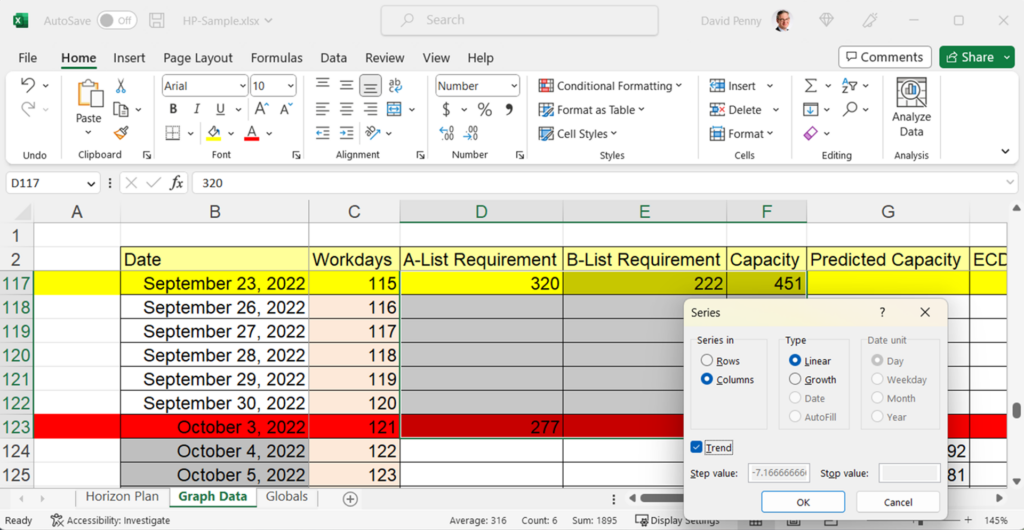
Choose Series in Columns, Type Linear, tick Trend, and hit OK. This fills in the missing values with a linear interpolation.
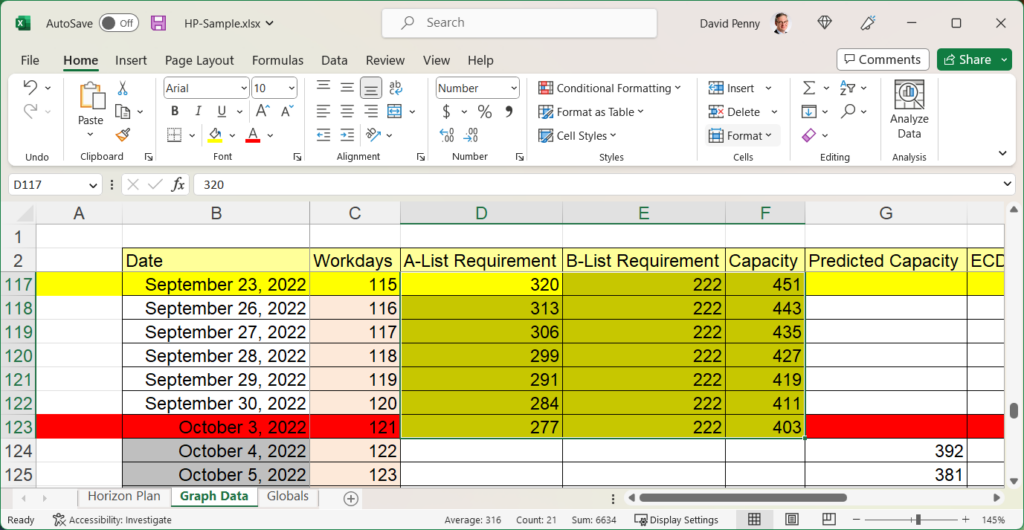
Reformat the cells to indicate the current update in red and the earlier updates in yellow.
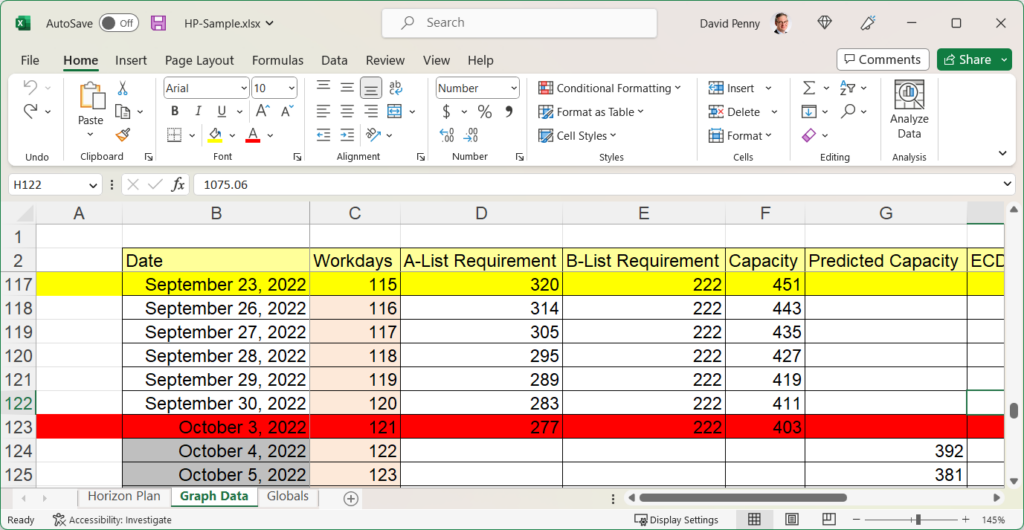
Blank the Predicted Capacity up to the current as-at (it is used to create the dotted blue line on the graph and is not needed before as-at).
The values that are copied in on each update are A-List Requirement (from B18), B-List Requirement (from F123), Capacity (from B17), ECDs logged to date (from B14), and Estimated ECDs (from B15). The first three plus the Predicted Capacity are used to create the chart in section C.
The ECDs logged to date and Estimated ECDs is used to create the chart in section D.

The blue line is Estimated ECDs plotted. I do not trend this series for the infill, I just carry the previous value forward, and update the values at and after the as-at date to be the current value.
The red line is Averaged Daily ECDs plotted. This is a column that’s computed from ECDs logged to date and exp decay factor (in cell J1).
I do a linear interpolation for the ECDs logged to date as shown above. Because each row is the next workday, the difference between any two adjacent values is the instantaneous (interpolated) ECDs logged that workday. You can see that by setting the exponential decay factor to 1 which means only the latest value is included in the “average” and no weight at all is given to history.
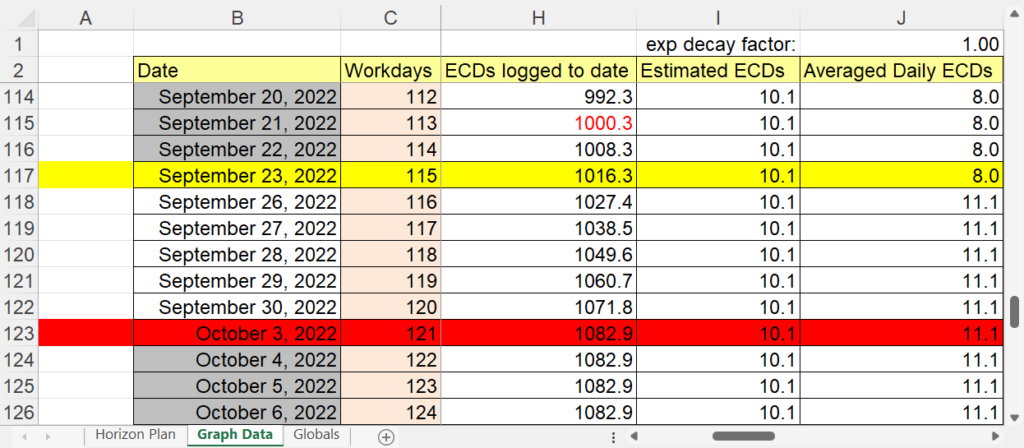
We can see that between Sep 23 and Oct 3 there were 11.1 ECDs logged per workday on average (they are identical because of the linear interpolation). The last value in the red row is just carried forward to the end by a formula. Keeping this factor at 1, we would get a very bumpy graph!
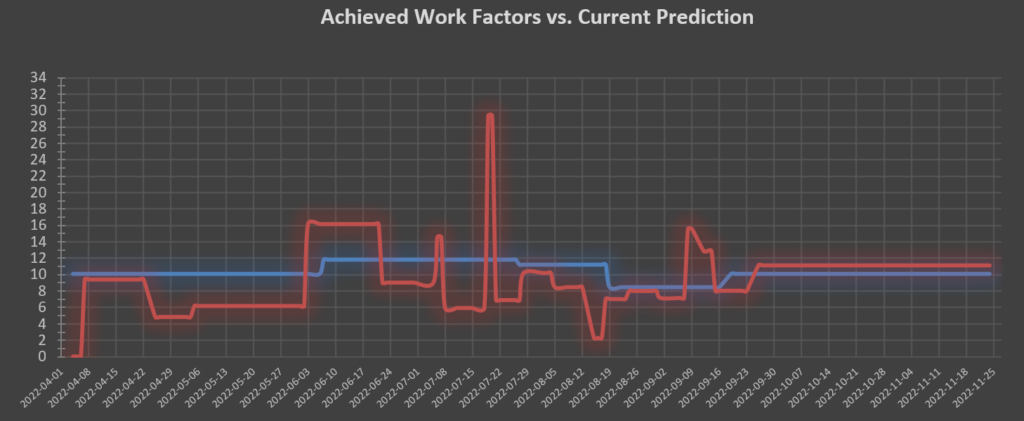
Some large spikes are because an update was made that added a lot of historical time tracked in on one day that was missed in earlier updates. This is the reason for smoothing these values with a factor of 0.1.
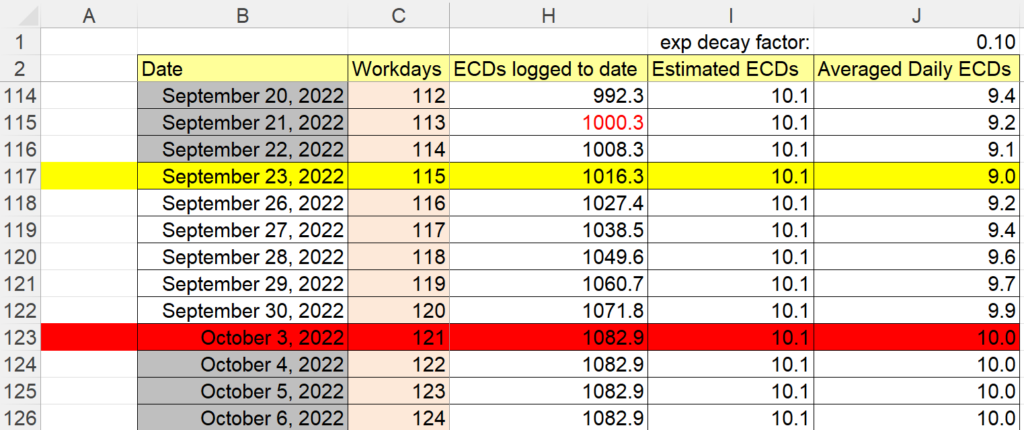
With 0.1, the most current value is only given 10% of the weight in the average, and the previous average is given 90%. So every value back to the beginning is somewhere in the average, it’s weight just drops off exponentially. This creates a more informative smoothed chart.
Globals Tab
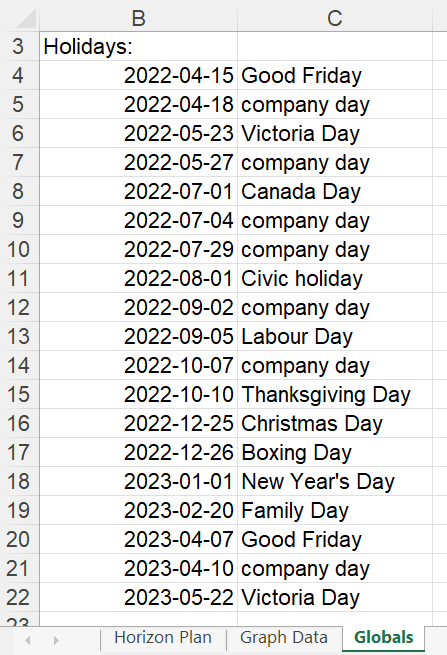
This tab is intended to collect global values referenced from elsewhere in the spreadsheet. Currently it only includes the holiday schedule which is used to compute the workdays net of the listed holidays between two dates.
A good example is cell B6 in the Dates section whose NETWORKDAYS formula is shown referencing the range “Holidays” (Globals!B4:B22).
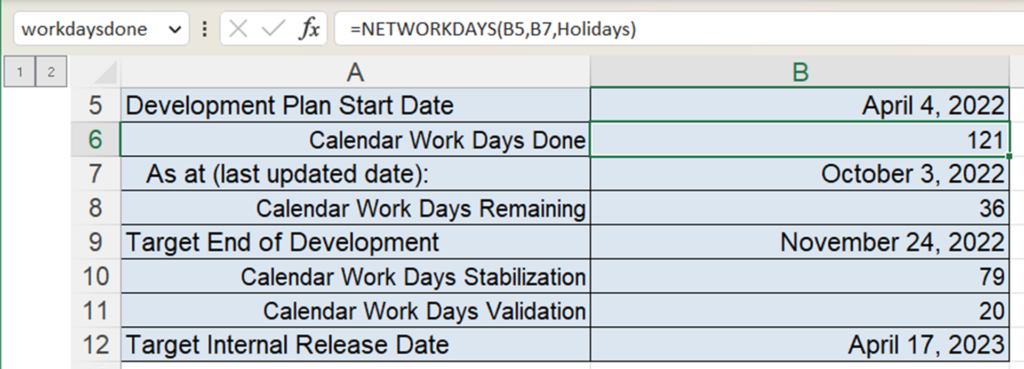
The opposite use is for computing the target end date in cell B12 after adding the stabilization and validation days.
